EUR/USD · H1 Chart Lesson
EUR/USD Chart Lesson, 10 November 2026: Bearish H1 structure aligned with the moving-average bias
Edition of 10 November 2026 · Chart data to the last completed hourly candle before publication
What the chart shows
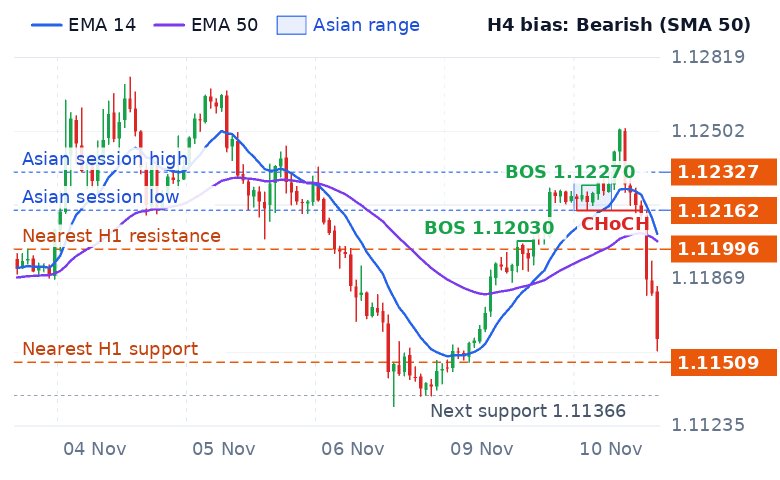
The bearish CHoCH through 1.12162 shifted control to sellers after earlier bullish BOS events. Price is below both EMAs, and H1 and H4 SMA 50 biases are bearish, aligning momentum with structure. This supports interpreting the CHoCH as a meaningful change in control, rather than a countertrend dip.
Why these levels matter
Nearest H1 support at 1.11509 is the immediate downside reference; nearest H1 resistance at 1.11996 is the first overhead barrier. Together, they frame the current bearish structure.
Confirmation and failed breakouts
A bullish reversal would require an H1 close above 1.11996 followed by a retest that holds; an H1 close back below 1.11996 after the break would invalidate it. Bearish continuation would require an H1 close below 1.11509 followed by a retest that holds; an H1 close back above 1.11509 after the break would mark a failed breakout.
The lesson
Here, the bearish CHoCH, price below the EMAs and bearish H1/H4 bias reinforce one another, but support still needs to confirm continuation.
What would change the picture
Beyond a confirmed bearish break, 1.11366 is the next support; reaching it would bring the next marked downside level into play.
Educational content only. This lesson explains how to read a chart; it is not a trading signal, forecast or recommendation.